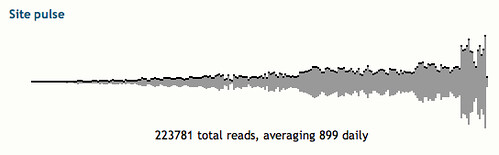
I imported the content of my old referrer tracking database as hits in my new bstat stats datatabase so I could have more data to work with. I mixed this with a fairly simple graphing routine and now we can see the “pulse” of the whole site and each story. Take a look at the bottom of the main page and between the body and comments in the single story pages to see what I mean. The jump in activity at the right of the graph represents the difference between the way I was counting referrers and how I’m now counting hits (I was only counting referrers from recognized search engines).
One problem I’ll have to figure out is what to do with new stories for which I have little tracking data, since the graphs for those look ugly. I’ll eventually do something to interpolate the data and generate more points for the bar graph.
Update: the plugin is now doing some really simple interpolation. It looks ugly, but not as ugly as it used to.
Update2: the interpolation looks better and more ‘pulse-like’ now, though at the cost of some accuracy. The next release will include an option to choose either accurate or jittery graphs.