You can’t view a web page’s source, and you can’t Command+F to search for text on the page, but you sure can get a debugging console to see the errors on the page. Here’s how:
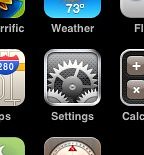
Find and open the Settings app
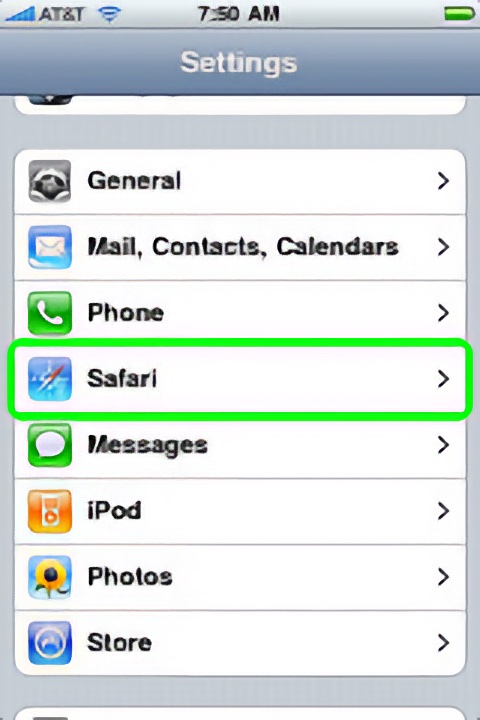
Select Safari
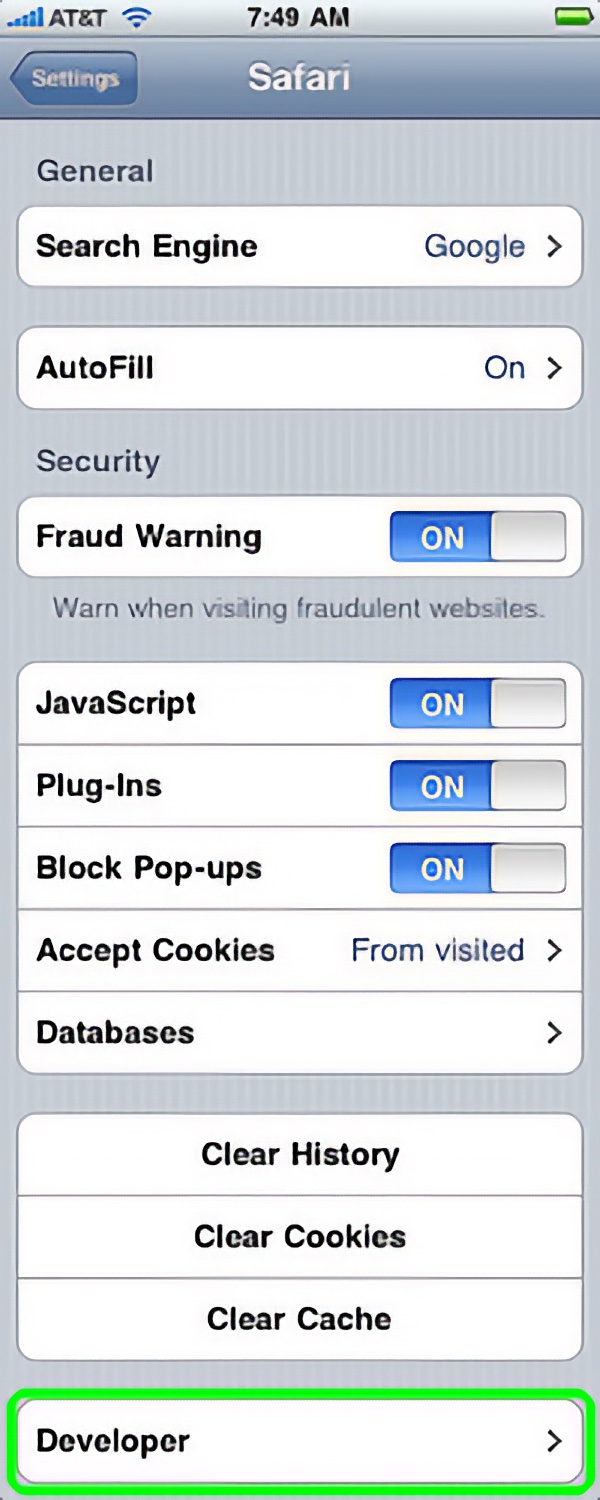
Scroll down to find the Developer option at the bottom
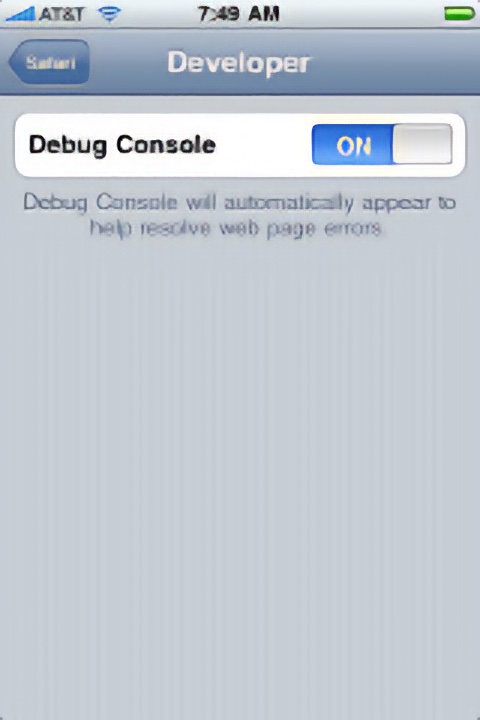
Turn on the Debug Console
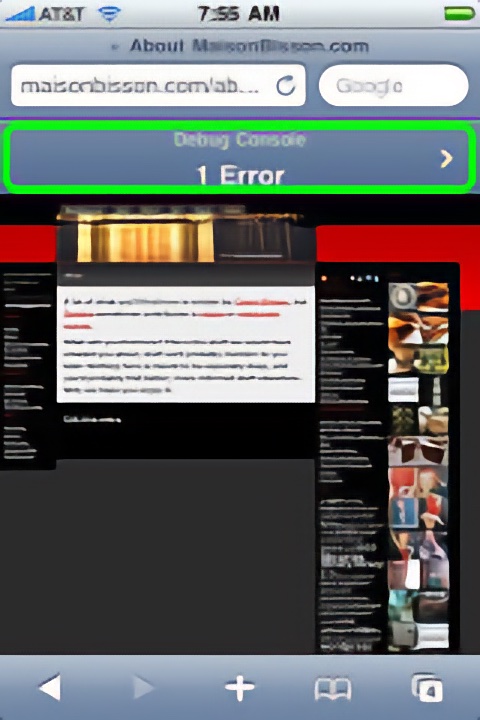
In Safari, look for the debug console’s summary info at the top of the page, just below the URL bar
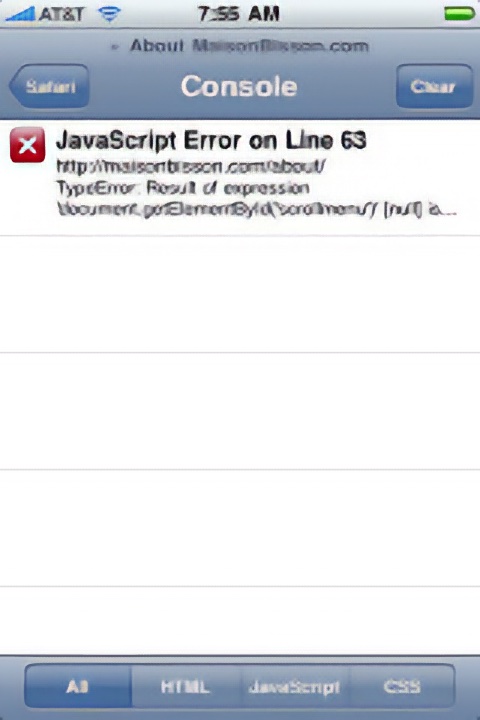
Touch the summary info to view a detailed report for the errors on the page